Traffic up, revenue flat: how to find where your store actually leaks conversion

By Robin Laseur

When traffic is up and revenue is flat, the money is leaking somewhere between the click and the payment, and the usual reflex, blame the ads and buy more traffic, sends good money after a leak it cannot reach. Revenue is traffic multiplied by conversion rate multiplied by average order value, so if traffic rose and revenue did not, conversion or order value fell by enough to absorb the increase. Finding where is a diagnosis, and it resolves to a specific stage in the funnel rather than a vague sense that the store underperforms. More traffic poured into a store that leaks does not fix the leak; it pays to send more people through the same gap.
This is the entry point to a diagnosis, not a list of things that might be wrong. The reason most advice on this problem does not help is that it hands you a menu of possible causes, low intent, weak product pages, checkout friction, slow speed, and leaves you to guess which is yours. This piece works the other way: it treats the store as a system with a known structure, shows how a flat revenue line has to trace to a measurable place in that structure, and walks through how to isolate that place, including the two checks that separate a real on-site leak from a problem that only looks like one. The goal is to point at the stage before anyone spends a euro fixing it.

The equation that explains a flat line
Start with the identity that governs the whole problem: revenue equals sessions multiplied by conversion rate multiplied by average order value. It is arithmetic, not theory, and it constrains what a flat revenue line can mean. If sessions rose and revenue held still, then conversion rate or average order value fell by the same proportion the sessions gained, because there is no other term in the equation for the increase to hide in. That single fact rules out a large amount of guessing before it starts.
The part that makes the leak hard to see is that conversion rate is not one number. It is the product of several stage pass-throughs multiplied together, the share of visitors who move from landing to a product, from a product to the cart, from the cart into checkout, and from checkout to a completed payment. Multiply those stage rates together and you get the headline conversion rate, which means the headline number can look stable while one stage inside it is bleeding and another is quietly compensating. A store whose overall conversion rate slipped from a healthy figure to a slightly-less-healthy one is not underperforming everywhere by a little; it is almost always leaking badly at one stage while the rest hold. The equation is what turns a vague problem into a locatable one: the flat line has a home, and it is a specific link in the chain.
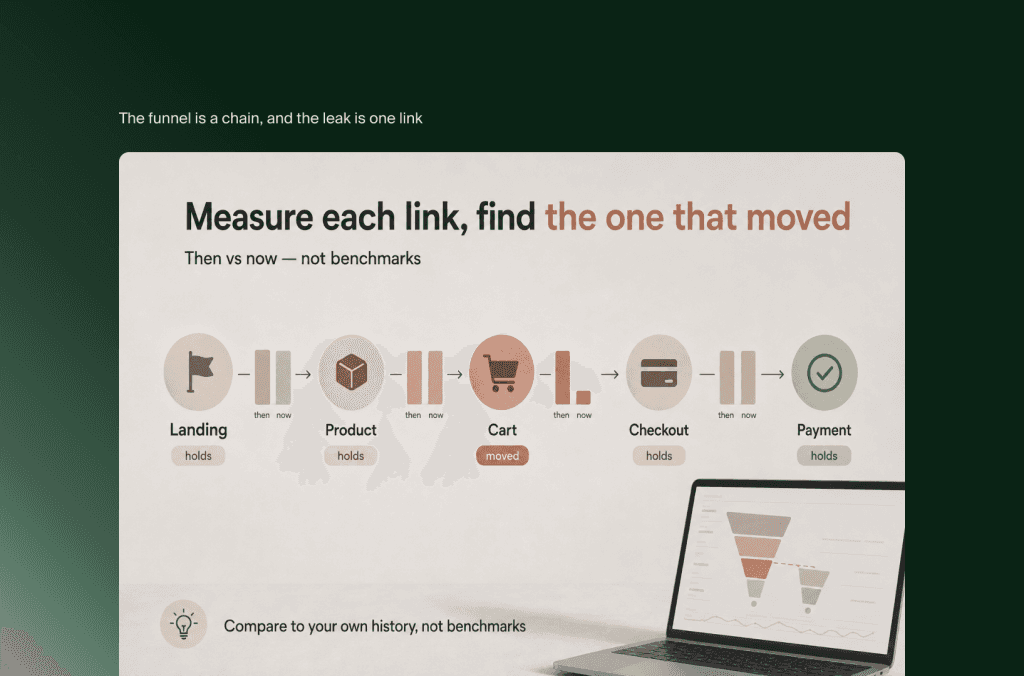
The funnel is a chain, and the leak is one link
Because conversion is a chain of stages, the diagnosis is to measure each link separately and find the one that dropped. Break the journey into its real steps, landing to browsing, browsing to a product page, product page to add-to-cart, cart to checkout started, checkout to payment completed, and calculate the pass-through rate at each. Every store’s steps differ slightly, but the principle holds: you are looking for the stage where the percentage moving forward falls off a cliff relative to the stages around it.
The comparison that matters is against the store’s own history, not against published benchmarks. Benchmarks tell you what other stores look like; they cannot tell you what changed in yours, and it is the change that explains a flat line that used to climb. Pull each stage’s pass-through for the period when revenue tracked traffic, and again for the period it went flat, and the leaking stage usually announces itself as the one that moved while the others stayed roughly constant. If add-to-cart held but checkout-started collapsed, the leak is in the cart. If product-page views are up but add-to-cart fell, the leak is on the product page. This is the core of the diagnosis, and on its own it locates most leaks, but two checks have to run alongside it, because a stage rate can fall for reasons that have nothing to do with a broken page.
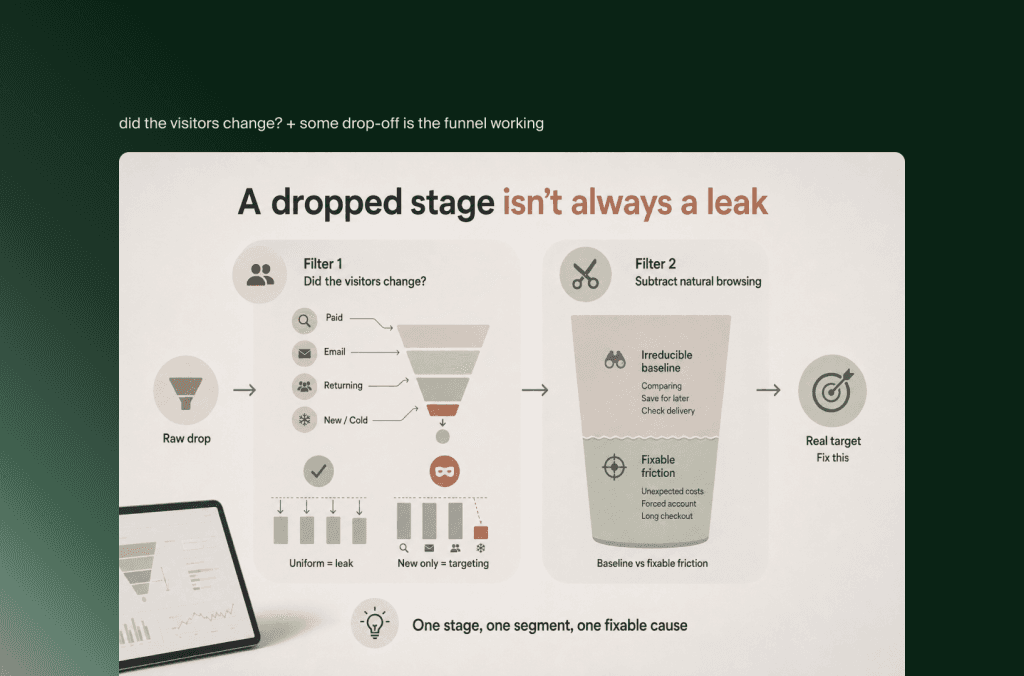
Before you blame the funnel: did the visitors change?
The first check is the one skipped most often, and skipping it is how teams fix pages that were never broken. A conversion rate can fall in two completely different ways: the same kind of visitors start converting worse, which is a genuine on-site leak, or a different kind of visitor starts arriving, which is a change in traffic quality, not in the store. These look identical in the headline number and need opposite responses, so telling them apart is not optional.
The reason this matters most right now is that the flat line often appears right after a team scales acquisition, and scaling acquisition almost always lowers average intent, because the easiest visitors to reach were already being reached. The new traffic is colder, broader, less ready to buy, and it converts worse not because the store changed but because the audience did. To check, segment the funnel by source, by new versus returning, and by landing intent, and look at whether the drop is uniform across segments or concentrated in the newly grown one. A leak that lives in every segment is an on-site problem. A drop that lives only in the new, lower-intent traffic is a targeting problem wearing a conversion mask, and no amount of product-page work will fix an audience that was never going to buy. Separating these two is what keeps the diagnosis pointed at the real cause.
Some drop-off is the funnel working, not leaking
The second check is to subtract the drop-off that is not a leak at all. A significant share of the people who abandon a cart or leave at checkout were never going to buy in that session, they are comparing, saving for later, checking delivery cost, or simply browsing, and that behaviour is a permanent feature of how people shop online rather than a fault in the store. The research on checkout abandonment at Baymard Institute makes the split clear: a large portion of abandonment is this natural non-buying behaviour, while the remainder is dominated by a short list of fixable frictions, unexpected costs revealed late, forced account creation, an overlong or confusing checkout.
The practical consequence is that the target is not the total drop-off at a stage, but the fixable portion of it. A cart-abandonment figure that looks alarming is partly an irreducible baseline you cannot design away and partly a genuine friction you can, and the diagnosis has to separate them, because effort spent chasing the baseline produces nothing while effort spent on the fixable friction moves the number. When you find the leaking stage, the next question is not “how do we stop everyone leaving here,” which is impossible, but “what specific, fixable friction at this stage is turning would-be buyers away,” which is answerable and worth doing.
Finding the one stage that explains the flat line
Put the three moves together and the diagnosis resolves. Decompose the funnel into stage pass-throughs and find the stage that moved when revenue went flat. Rule out a traffic-quality shift by checking whether the drop is uniform or concentrated in newly added low-intent segments. Subtract the natural, irreducible browsing behaviour to isolate the fixable friction inside the leaking stage. What remains is the actual leak: a specific stage, driven by a specific fixable cause, in a specific segment of traffic. That is a problem you can brief, scope, and fix, which a vague “conversion is down” never is.
This is why the higher-leverage move is to locate where qualified traffic actually stalls before running any test, rather than opening a backlog of experiments against the whole store. A diagnosis aimed at one stage, in one segment, on one fixable cause, is worth more than a season of tests scattered across pages that were converting fine. It is the pattern behind Flatline’s conversion work with brands like the fashion label Olivia & Kate, where the gains came from reading the purchasing flow, product presentation, the friction between browsing and checkout, and treating the store as a journey to be diagnosed rather than a set of pages to be redecorated. The leak is findable, it is usually singular, and it is almost never fixed by buying more of the traffic that revealed it. The stages of that journey, and the specific tools for reading each one, are where the rest of this diagnosis goes next.
Frequently asked questions
Why is my traffic up but revenue flat?
Because revenue is sessions multiplied by conversion rate multiplied by average order value, and if sessions rose while revenue held, then conversion rate or order value fell to absorb the gain. The cause sits somewhere between the click and the payment, either a specific funnel stage that started leaking, or a shift in traffic quality that lowered average intent. More traffic does not fix it; it sends more people through the same gap.
How do I find where my store loses conversions?
Break the funnel into its stages, landing, product, cart, checkout, payment, and measure the pass-through rate at each against the store’s own history. The stage that dropped while revenue went flat is where the leak is. Then confirm the drop is not caused by a change in traffic quality, and subtract the natural browsing behaviour that is not fixable, to isolate the specific fixable friction at that stage.
Is flat revenue a traffic problem or a conversion problem?
It can be either, and they need opposite fixes, so the diagnosis has to tell them apart. If the same kinds of visitors are converting worse across all segments, it is an on-site conversion leak. If the drop is concentrated in newly added, lower-intent traffic, it is a traffic-quality problem, common right after scaling acquisition, and product-page work will not solve it. Segmenting the funnel by source and intent is what separates the two.
How do you diagnose a conversion funnel leak?
Decompose the funnel into stage pass-throughs, compare each stage to its own past to find the one that moved, rule out a traffic-quality shift by segmenting, and subtract the irreducible browsing baseline to isolate fixable friction. The output is a single stage, a single segment, and a single fixable cause, rather than a general sense that conversion is down. That specificity is what makes it fixable.
Does more traffic fix flat revenue?
Only if the constraint was genuinely a shortage of traffic, which a flat line under rising traffic already rules out. When revenue is flat while traffic climbs, the store is not converting the visitors it has, so adding more visitors scales the leak rather than closing it. The return comes from finding and fixing the leaking stage first, then growing traffic into a funnel that can hold it.
Key takeaways
Revenue equals sessions times conversion rate times average order value. If traffic rose and revenue is flat, conversion or order value fell to absorb it, and the cause is a locatable place in the funnel.
Conversion rate is the product of stage pass-throughs, so a stable headline rate can hide one stage leaking while others compensate. Decompose the funnel and measure each stage against its own history.
Check traffic quality before blaming the funnel. Scaling acquisition lowers average intent, so a drop concentrated in new, low-intent segments is a targeting problem, not a broken page.
Subtract the drop-off that is not a leak. A large share of cart and checkout abandonment is natural browsing behaviour; the target is the fixable friction inside a stage, not the irreducible baseline.
The output of the diagnosis is one stage, one segment, one fixable cause. That is briefable and scopable, and it is almost never solved by buying more of the traffic that revealed it.
A flat revenue line under rising traffic is not a mystery and it is not a reason to spend more on ads. It is a measurement problem with a definite answer: some stage between landing and payment is passing fewer people forward than it used to, for a reason that is either fixable friction or a change in who is arriving. Decompose the funnel, separate the leak from the traffic shift, subtract the browsing that was never going to convert, and the flat line stops being a vague disappointment and becomes a specific thing to fix. The diagnosis is the work. The spend was never the answer.
Related articles


