Blended CAC Is Lying to You: The DTC Numbers That Decide Whether Growth Is Profitable

By Robin Laseur

The acquisition number on your dashboard is probably making your spend look healthier than it is. Blended customer acquisition cost divides all your ad spend by all the customers you got, and the customers you got include returning buyers you did not pay to acquire. Those free orders sit in the math and quietly subsidise it, so the figure you use to decide tomorrow’s budget can look comfortable while the true cost of buying a genuinely new customer sits near break-even. Three numbers actually govern that decision: new-customer CAC, contribution margin, and true new-customer ROAS. This explains why the blended figure flatters you, and how those three tell you whether growth is profitable.
What blended CAC actually measures
Blended CAC takes your total acquisition spend from the finance ledger and divides it by the total number of new customers from your order data. Its appeal is real: because the numerator is what you actually spent and the denominator is what you actually got, it cannot be gamed by ad-platform attribution settings the way channel-reported numbers can. That is why it became the operator community’s default around 2021 to 2023, promoted by the analytics platforms.
The problem is not that blended CAC is wrong. It is that it answers a different question than the one you ask of it. Blended CAC tells you the average cost across your whole acquisition portfolio, including the parts that cost you nothing. When you use it to decide whether to spend the next paid dollar, you are reading a portfolio average as if it were the marginal cost of a paid customer, and those two numbers can be far apart.
How the number flatters you
Here is the mechanism, step by step. Your paid channels bring in genuinely new customers at a genuinely high cost. Separately, your brand pulls in returning buyers and organic customers who cost you little or nothing to convert. Blended CAC pools both groups into one denominator. The free and cheap customers drag the average down, so the blended figure looks efficient even when the paid, net-new portion is expensive. Polar Analytics calls this the omnichannel-CAC trap: returning-customer orders you did not pay to acquire subsidise the math, so your acquisition looks healthier than it is.
The size of that gap is not small. On Eightx’s synthesis of DTC benchmark data, paid CAC runs roughly 2.4 to 3.1 times blended CAC across most categories. In practice that means a brand reporting a comfortable blended CAC near $75 can be paying closer to $180 to acquire each genuinely new customer through ads. The blended number said the acquisition engine was fine. The new-customer number says it may be running at break-even. That is the second-order problem with blended CAC: the metric you trust most is the one hiding the thing you most need to see, and it hides it precisely when your brand is strong enough to have a healthy returning-customer base masking the paid economics.
Treat those multiples as directional and model your own. The ratio depends heavily on your vertical and how much organic pull your brand has, so the point is the mechanism, not the exact number.
The three numbers that actually decide a spend decision
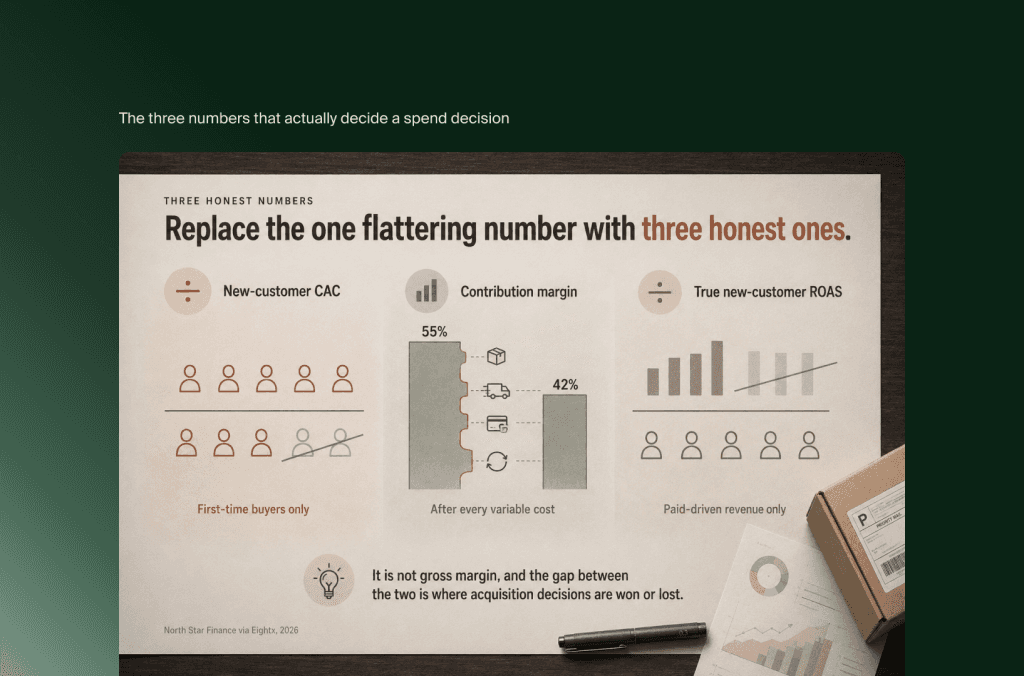
Replace the one flattering number with three honest ones. Defined once and read together, they tell you whether a paid dollar is profitable.
New-customer CAC
New-customer CAC is your paid acquisition spend divided by the number of first-time buyers it produced, not all orders. Per Polar Analytics, this is the number that tells a brand what it truly costs to buy someone who has never bought before, and it is the exact figure blended CAC conceals. Count only net-new customers in the denominator, and include all the costs of acquiring them, not just media. This is the cost your margin actually has to cover.
Contribution margin
Contribution margin is what a sale earns after every variable cost: gross profit minus fulfilment, shipping, payment processing, returns, and variable marketing. It is not gross margin, and the gap between the two is where acquisition decisions are won or lost. Median DTC contribution margin has compressed from roughly 35 percent in 2021 to about 22 percent in 2025, per Fairview’s analysis via Daymark, and returns quietly widen the gap: North Star Finance’s worked example, reported by Eightx, shows a 55 percent gross margin falling to about 42 percent once return costs land. Contribution margin is the ceiling, and it sets the guardrail for what you can afford to pay to acquire a customer.
True new-customer ROAS
Blended ROAS and MER carry the same flaw as blended CAC, from the revenue side: they credit paid spend with revenue from returning customers who would have bought anyway. True new-customer ROAS measures the revenue from paid-driven new customers against the paid spend that produced them. It is the ROAS version of the same honesty, and it stops your reporting from taking credit for a flywheel your ads did not turn.
Reading the gap between blended and new-customer CAC
Once you have both the blended and the new-customer figures, the distance between them is itself a diagnostic, and a useful one.
If your blended and paid or new-customer CAC are close together, your organic engine is weak and you are effectively buying nearly every customer you get, so your growth is fully exposed to rising ad costs. If they diverge widely, your brand has genuine pull, and a meaningful share of your customers arrive without paid spend. Widening that gap deliberately, by building the organic, retention, and word-of-mouth demand that lowers blended cost, is a real strategic goal rather than an accident. The gap you were hiding by looking only at the blended number turns out to be one of the more informative things on your dashboard, once you compute both sides of it.
Putting it together: is this spend profitable?
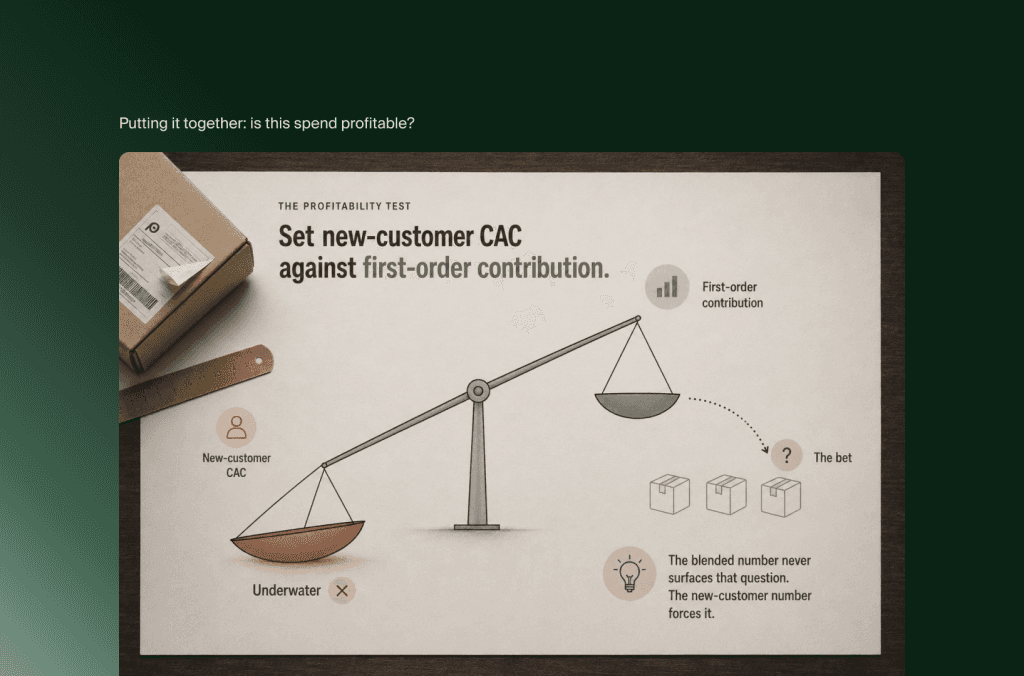
The decision comes down to one comparison, made with the honest numbers. Set your new-customer CAC against your first-order contribution margin. If new-customer CAC is higher than the contribution a first order produces, you are underwater on acquisition at the point of sale, and you are betting on repeat purchases to bail out the deficit later. That bet can be sound, if your retention and lifetime value genuinely support it and your payback lands inside a few months, and it can be quietly fatal if they do not. The blended number never surfaces that question. The new-customer number forces it.
Two disciplines make the comparison trustworthy. Count honestly: net-new customers only in CAC, all variable costs in contribution margin. And measure by channel and cohort rather than as one blended figure, because a single average hides which part of the system is actually working, whether the axis is paid versus organic or one channel versus another. If you want a second read on your true new-customer economics, built from your real contribution margin rather than a blended dashboard, that measurement work is something Flatline does with DTC brands. The first step costs nothing: separate the customers you paid for from the ones you did not, and recompute.
Once you know what a new customer really costs, the next decision is how to split budget between acquisition and retention.
Key takeaways
Blended CAC divides all spend by all customers, including returning buyers you did not pay to acquire, so it flatters your paid economics and reads as a marginal cost when it is really a portfolio average.
Paid CAC runs roughly 2.4 to 3.1 times blended CAC on Eightx’s synthesis, so a comfortable-looking blended figure can hide new-customer acquisition sitting near break-even. Treat the multiples as directional and model your own.
Three numbers govern a spend decision: new-customer CAC (paid spend divided by first-time buyers), contribution margin (after all variable costs), and true new-customer ROAS (paid-driven new revenue over paid spend).
The gap between blended and new-customer CAC is itself a signal: converging means weak organic and full exposure to ad-cost inflation; diverging means real brand pull.
The profitability test is new-customer CAC against first-order contribution margin. If CAC is higher, you are betting on retention to cover the deficit, and only honest, cohort-level numbers tell you whether that bet is safe.
FAQ
What is the difference between blended CAC and new-customer CAC?
Blended CAC is total acquisition spend divided by all new customers, which folds in buyers your brand and organic channels brought in for little cost. New-customer CAC is paid spend divided by first-time buyers from paid, so it isolates what it actually costs to acquire someone who has never bought before. Blended flatters your paid economics; new-customer CAC shows them.
Why does my blended ROAS look healthy while the business feels tight?
Because blended ROAS credits paid spend with revenue from returning customers who would have bought anyway. The paid, net-new portion of your acquisition can be near break-even while the blended figure looks strong, since your returning-customer revenue is subsidising the average. True new-customer ROAS, which counts only paid-driven new revenue, removes that flattery.
Which numbers should I actually use to decide ad spend?
New-customer CAC, contribution margin, and true new-customer ROAS, read together and by channel. Compare new-customer CAC against first-order contribution margin to see whether each new customer is profitable at purchase or dependent on later repeat orders, and track the gap between blended and new-customer CAC as a measure of your organic strength.
Related articles


