New customers keep coming, none come back: the retention math that decides whether growth is profitable

By Robin Laseur

A store can add more new customers every month than it did the month before and lose more money every month at the same time. The retention math is the reason. Whether growth is profitable is decided by whether each customer’s lifetime contribution margin exceeds what you paid to acquire them, and that figure is set by the repeat rate, not by how many new buyers you add. New-customer count is an input you can buy. Profit is what the second purchase decides.
That distinction is where most growth stories quietly come apart. The dashboard shows revenue climbing and the acquisition team hitting target, so the business reads healthy. Underneath, if the customers arriving this quarter behave like the ones from last quarter and never place a second order, every one of them was bought at a loss, and scaling the channel scales the loss. A business that only ever sells once is renting its growth from the ad platform, and the rent goes up every auction.
This is a walk through the arithmetic that settles the question, the drivers that move it, and the specific points where the model stops holding. The numbers below are illustrative. The structure they sit in is not.
Why a store can grow every month and still lose money
Growth and profitable growth are different measurements that happen to move together in the early months, which is what makes the gap so easy to miss. New-customer count rises the moment you raise ad spend. Profit only rises if the customers you bought return enough times to clear their acquisition cost. When acquisition is cheap those two lines track each other closely, so the distinction feels academic. When acquisition gets expensive, they separate, and the business that never learned to read the second line finds out the hard way.
The trap sits in which number the team celebrates. New customers acquired is visible, immediate, and satisfying to report. The value each of those customers goes on to generate is slow, arrives over months, and lands in a different report that fewer people read. So the organisation optimises the number it can see. Spend goes up, new customers go up, the top line goes up, and the question of whether those customers were worth acquiring gets answered much later, in cash the business no longer has.
The case that retention drives profitability is long established, though it travels as a heuristic whose range varies by industry rather than a fixed law, a useful reminder that the direction is settled while the exact numbers are always yours to work out. None of this shows up while the market is subsidising you. Rising acquisition cost is the mechanism that exposes it. As the auction gets more expensive, the margin between what a first order contributes and what a customer costs to acquire narrows and then inverts, and a model that depended on cheap first orders has nothing underneath it. The math was always this way. Cheap traffic just hid it.
First-order breakeven is the wrong finish line
Contribution margin is the money a sale leaves behind after the variable costs of fulfilling it: cost of goods, payment fees, pick-and-pack, shipping. It is not revenue, and it is not the number ROAS reports. A store measuring profitability on revenue or on ad return is measuring a finish line that sits well short of the real one, because neither figure has paid for the product yet.
Work a single order. Take an average order value of €50 and variable costs (product, fulfilment, payment) of 40%, which leaves €30 of contribution per order. Now put an acquisition cost of €35 against it. That first order does not break even. It loses €5. On revenue the sale looks like a €50 win. On ROAS it may look efficient. On contribution, the number that actually feeds the business, the customer is five euros underwater the moment they arrive.
If that is the whole relationship, the business is a machine for converting ad budget into losses at scale, and every efficiency gain in the funnel makes it worse by bringing in more of the same. The first order is not supposed to be the finish line. For most transactional brands it is the cost of entry, the sample you pay to place in someone’s hands so they can decide whether to come back. Whether the model works is decided entirely by what happens after it. Measuring at first-order breakeven answers the wrong question and answers it too early.
How the repeat rate quietly rewrites your unit economics
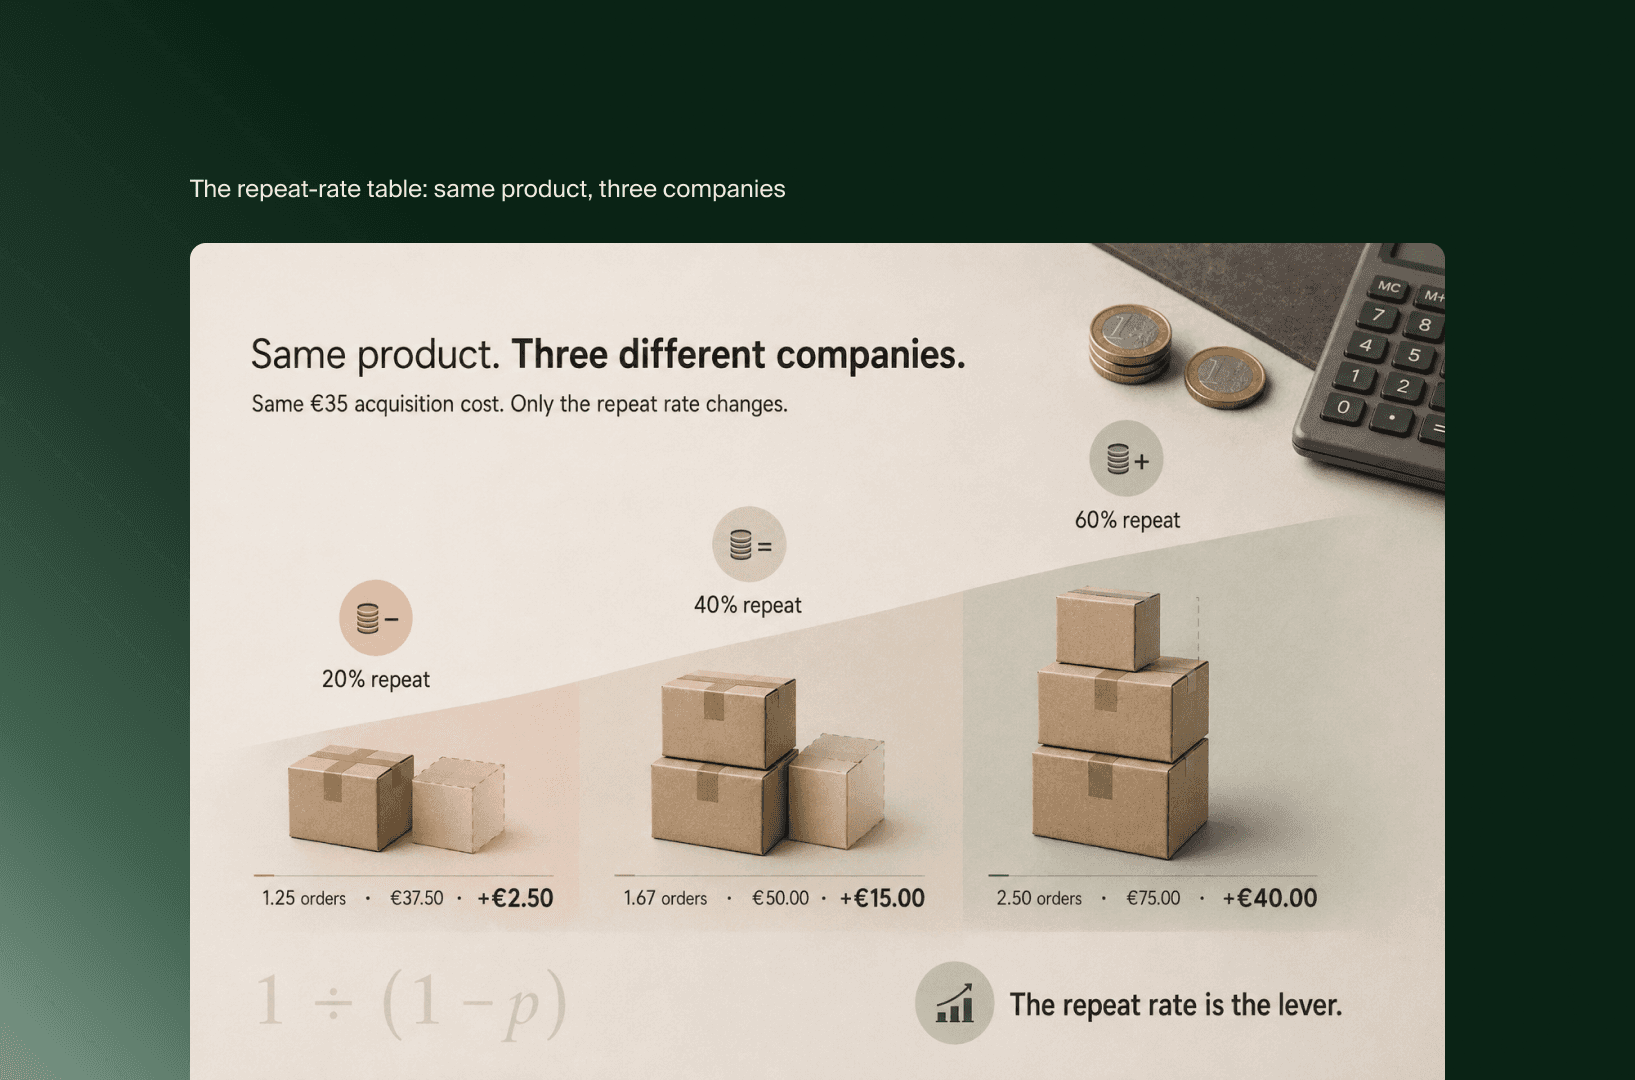
Lifetime value is not a fixed property of a customer. It is a function of the repeat rate, and the relationship is not linear, which is why two brands with identical products and identical acquisition costs can be completely different businesses. A useful first approximation: if a customer has a constant probability p of placing another order, the expected number of orders they make is roughly 1 ÷ (1 − p). Small changes in p move that figure sharply.
Hold the €30 contribution per order and the €35 acquisition cost from the section above, and read what the repeat rate does to the same customer.
Repeat rate (p) | Expected orders (1 ÷ (1−p)) | Lifetime contribution | After €35 CAC |
20% | 1.25 | €37.50 | +€2.50 |
40% | 1.67 | €50.00 | +€15.00 |
60% | 2.50 | €75.00 | +€40.00 |
Same product, same acquisition cost, three different companies. At a 20% repeat rate the customer clears their acquisition cost by €2.50 and the business is one bad ad week from unprofitable. At 60% the same customer is worth more than twice what they cost, and the acquisition team can afford to bid harder than any competitor stuck at 20% can survive. The repeat rate is the lever, and it moves the outcome faster than acquisition efficiency ever will, because it compounds where acquisition only adds.
This is also where the familiar “aim for LTV:CAC of 3:1” rule of thumb gets slippery. That ratio is usually quoted on a loose definition of lifetime value, often revenue-based, sometimes counting orders the discount code paid for. Run it on contribution, the way the table above does, and 3:1 is a genuinely strong position rather than a starting benchmark. The ratio is only as honest as the LTV you feed it, and a revenue-based LTV flatters a business that a contribution-based one would flag.

Why “good” unit economics can still run you out of cash
CAC payback period is the number of months it takes for a customer’s accumulated contribution to repay what you spent acquiring them. A business can have a healthy lifetime ratio and a payback period long enough to run it out of cash, because the ratio describes the eventual outcome and the payback describes when the money actually arrives. Growth is financed in the gap between the two.
Picture the 60% repeat customer from the table, worth €75 in lifetime contribution. Healthy on paper. Now suppose the second purchase typically lands nine months after the first. For nine months you have paid €35 to acquire that customer and recovered €30, and you are financing the shortfall on every customer you acquire, all at once, while scaling. The faster you grow, the wider the cash hole gets, because each new cohort opens its own nine-month gap before it starts paying you back. Brands do not usually fail because the lifetime math was wrong. They fail because the timing of it outran the bank balance.
This is why velocity belongs in the model, not just the ratio. Time to second purchase is a lever in its own right. Compressing it from nine months to three does not change lifetime value by a cent, and it can be the difference between growth that funds itself and growth that needs a raise to survive. A slower payback is a heavier cash requirement hiding inside numbers that read as success.
The second purchase is where the whole model turns
Across a transactional catalogue, the single highest-leverage moment is the move from one order to two. The curve is steepest there. Going from a 20% to a 40% repeat rate on that first transition does more for lifetime value than any equivalent gain further along the sequence, because it multiplies against every order that follows and because the largest population of customers sits at exactly that decision point, having bought once and not yet decided about twice.
The reason is structural rather than motivational. A customer who has bought a second time has crossed from trying you to using you, and repeat probability on later orders is generally higher than on that first return. The account, the reorder habit, the sense that the product does what it promised, all of it forms in the 1-to-2 window. A brand like Gisou, whose growth leans on a consumable people either reorder or abandon, lives or dies on that transition long before any loyalty tier matters. Everything downstream compounds a base rate that this one step sets.
Which reframes where the work goes. Most retention effort spreads thinly across the whole lifecycle, a win-back here, a loyalty perk there. The math says concentrate it: the euro spent making the second purchase happen returns more than the same euro spent almost anywhere else in the customer relationship. The way that second purchase actually gets engineered is a separate build, but the priority is set here, in the arithmetic.

Where this math stops working
A model is only useful if you know its edges, and this one has four that matter. Each is a place where the clean version above quietly misleads, and each is the kind of caveat a quick answer leaves out.
Long replenishment cycles and durable goods. The repeat model assumes a product bought on a rhythm. A mattress sells once a decade. A sofa, a wedding dress, a one-off gift, these do not generate a second purchase in any timeframe the acquisition math cares about. For these categories lifetime value has to come from somewhere other than reorders: referral, range expansion into adjacent products, or a genuinely higher first-order margin that stands on its own. Applying repeat-rate math to a durable-goods brand produces a target it can never hit and a diagnosis that blames the wrong thing.
Blended CAC hides the truth. The arithmetic only holds cohort by cohort and channel by channel. A blended acquisition cost that averages your cheap organic customers with your expensive paid ones can show a comfortable number while the paid cohort you are scaling loses money on every order. The average stays calm while the marginal customer, the one your next euro actually buys, is deep underwater. Read blended, the model reassures you. Read by cohort, it tells you the truth.
Repeat rate is not constant. The 1 ÷ (1 − p) shortcut assumes a fixed repeat probability, and real customers do not behave that way. The probability usually rises after the second order and differs by acquisition source, by first product, by whether a discount drove the initial purchase. A repeat bought with a 30% off code is not the same euro as a repeat bought at full price: the order came back but the margin did not. Naive lifetime value, built on an average repeat rate and full-price contribution, overstates the number for exactly the cohorts you most need to watch.
Averages lie about the distribution. Average lifetime value is dragged upward by a small group of high-frequency customers, so the mean can look healthy while the median customer never clears acquisition cost. If you plan around the average, you plan around a customer most of your base is not. The distribution, not the mean, tells you whether the business works, and it usually tells a less flattering story.
None of these break the principle that retention sets profitability. They break the shortcut. The fix in every case is the same: measure closer to the real customer and further from the convenient average.
What to measure instead
The intervention follows directly from the drivers, and it is mostly a matter of changing which numbers the business watches.
Measure contribution margin, not revenue or ROAS, so the first-order loss is visible instead of dressed up as a win. Read acquisition cost and lifetime value by cohort and by channel, never blended, so the marginal customer stops hiding behind the average. Track CAC payback in months, not just the lifetime ratio, so a cash-hungry growth plan announces itself before the bank balance does. And treat the one-to-two transition as the priority it mathematically is, rather than spreading retention effort evenly across a lifecycle that does not reward it evenly.
Fix the measurement and the strategy tends to correct itself, because most of the bad decisions here come from optimising a number that was never the one that decided profit. Retention is not a channel or a tactic in this framing. It is the unit economics, and the math is what tells you whether the growth you are buying is worth the price.
With the unit economics in hand, the budget decision follows: whether your next euro belongs in acquisition or retention.
Frequently asked questions
What is a good repeat purchase rate for an ecommerce store? It depends on the category and the price point, so a single benchmark misleads more than it helps. The useful test is not an industry average but your own math: a repeat rate is high enough when lifetime contribution margin comfortably clears acquisition cost with room for a slow payback. A consumable brand and a furniture brand can both be healthy at rates that look nothing alike.
How do you calculate lifetime value for a store with no subscriptions? Start from contribution per order (average order value minus variable costs), estimate the expected number of orders from your repeat rate, and multiply. Keep it contribution-based, not revenue-based, and build it from real cohort behaviour rather than an average across the whole base. A subscription is not required for the math; a predictable repeat pattern is.
Should the next euro go to acquisition or retention? The answer changes with your repeat rate, which is the decision this pillar sets up rather than settles. Below a certain repeat threshold, another acquisition euro can still be the better investment; above it, a euro spent lifting the second-purchase rate returns more. Knowing which side of that line you sit on is the whole allocation question.
Key takeaways
New-customer growth and profitable growth are different measurements. The first is an input you buy; the second is decided by whether each customer’s lifetime contribution margin clears their acquisition cost.
Measure on contribution, not revenue or ROAS. A first order that looks like a €50 win can be a €5 loss once variable costs and acquisition are counted, and scaling multiplies it.
Lifetime value is a function of the repeat rate, and the relationship is nonlinear. The same product and the same acquisition cost produce a marginal business at 20% repeat and a strong one at 60%.
A healthy lifetime ratio can still run you out of cash if payback is slow. Track CAC payback in months and treat time-to-second-purchase as its own lever.
The math has edges: durable goods, blended CAC, non-constant repeat rates, and skewed distributions each break the shortcut. Measure by cohort and by median, not by convenient average.
If one person in the business should read this, it is whoever owns the ad budget. Save it, and the next time the new-customer chart looks healthy, run the second line underneath it.
Related articles


F.A.Q.

What is a good repeat purchase rate for an ecommerce store?
It depends on the category and the price point, so a single benchmark misleads more than it helps. The useful test is not an industry average but your own math: a repeat rate is high enough when lifetime contribution margin comfortably clears acquisition cost with room for a slow payback. A consumable brand and a furniture brand can both be healthy at rates that look nothing alike.
How do you calculate lifetime value for a store with no subscriptions?
Start from contribution per order (average order value minus variable costs), estimate the expected number of orders from your repeat rate, and multiply. Keep it contribution-based, not revenue-based, and build it from real cohort behaviour rather than an average across the whole base. A subscription is not required for the math; a predictable repeat pattern is.
Should the next euro go to acquisition or retention?
The answer changes with your repeat rate, which is the decision this pillar sets up rather than settles. Below a certain repeat threshold, another acquisition euro can still be the better investment; above it, a euro spent lifting the second-purchase rate returns more. Knowing which side of that line you sit on is the whole allocation question.