The Hidden Operational Cost of Enterprise Platform Complexity

By Robin Laseur

Enterprise platform cost or budgets are built around one number: the license fee. It is the figure that gets negotiated once a year, the line the CFO scrutinizes, the cost everyone agrees they are paying. It is also, for most enterprise operations, the smallest part of what the platform actually costs.
The larger cost never appears on an invoice. It accumulates quietly. In the days a campaign waits for developer time, in the integrations a team maintains indefinitely, in the roadmap items that slip another quarter because the platform cannot move as fast as the business wants to. None of these have a line item. None of them get evaluated at budget time. And because they are never named as costs, they are never questioned.
This is not an argument about price. It is about the gap between what an enterprise pays on its contract and what it pays, every day, to keep the operation running. Once that gap is visible, the question about platform cost changes shape entirely.
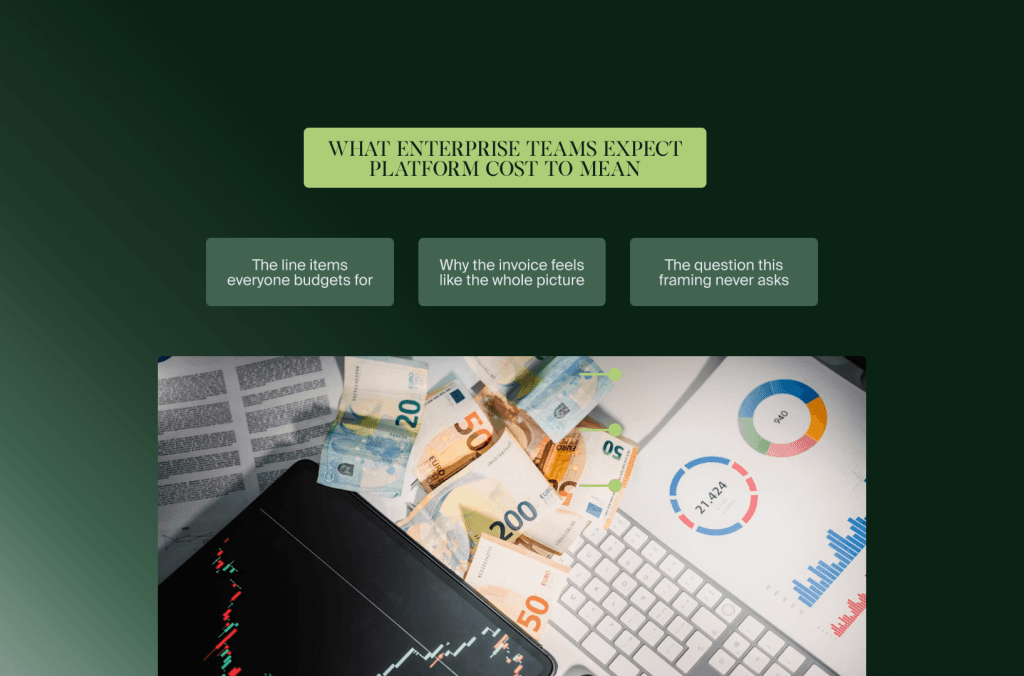
What enterprise teams expect platform cost to mean
When a platform decision comes up for review, the cost conversation tends to gravitate toward the figures that are easy to see. They are the numbers that sit in a contract, that a finance team can model in a spreadsheet, that a procurement process is built to compare. The trouble is not that these numbers are wrong. It is that they are partial, in a way that is hard to notice from inside the budget.
The line items everyone budgets for
The recognized costs are consistent across most enterprise operations: the platform license or subscription, hosting and infrastructure, a support or success tier, and, depending on the platform, transaction or processing fees. For a brand running a legacy enterprise stack, there is usually a development retainer in there too, treated as a fixed cost of doing business rather than a signal about the platform itself.
These are real, and they belong in the budget. The point is not that teams overlook them. It is that this list feels complete, and the moment it feels complete, the analysis stops.
Why the invoice feels like the whole picture
An invoice is a closed document. It states an amount, the amount is paid, and the transaction resolves. That sense of resolution is exactly what makes it misleading as a measure of cost. The platform invoice tells you what the vendor charges. It says nothing about what the platform requires from your operation to function, and on a complex enterprise stack, what it requires is substantial.
For a Head of eCommerce assembling an annual platform budget, the license and infrastructure figures are also the only ones available with any precision. The operational costs are diffuse, spread across team calendars and release schedules and deferred plans, which makes them feel less like costs and more like background conditions of the work. So they get left out, not by oversight, but because they resist the format a budget is built in.
The question this framing never asks
There is a question the standard cost view never reaches: what is it costing the operation to run on this platform, beyond what the vendor charges to provide it? Not the price of the platform, but the price of operating it. That is a different number, and for most enterprise stacks it is the larger one. The rest of this article is about where it hides and how to see it.
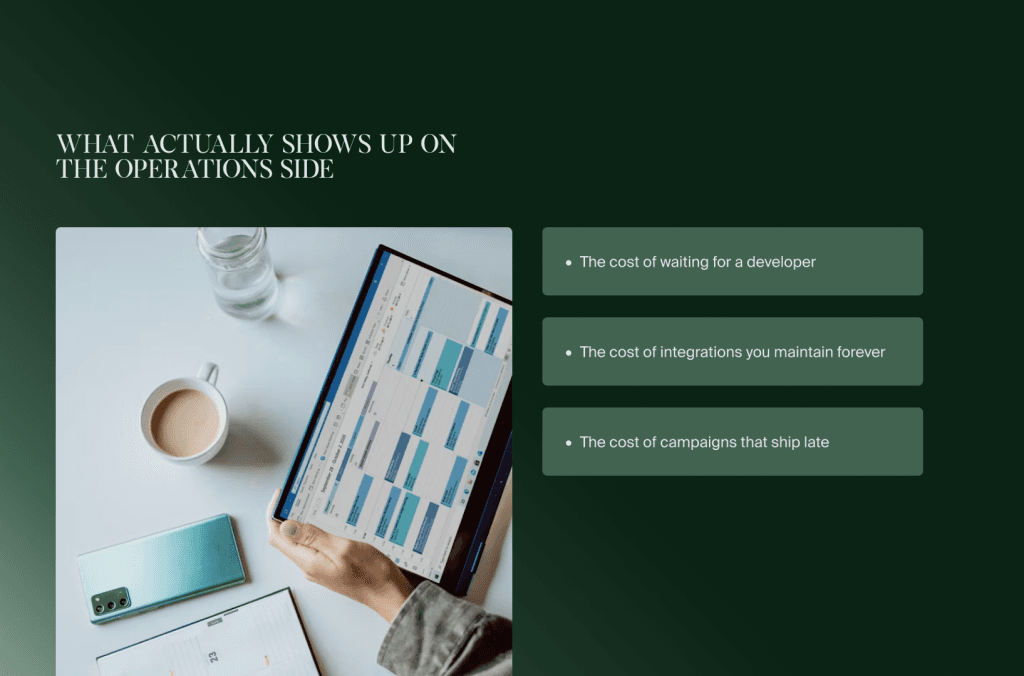
What actually shows up on the operations side
If the invoice is the wrong place to look, the right place is the calendar. The true cost of an enterprise platform lives in how the operation spends its time, and on a legacy stack, a surprising amount of that time goes to working around the platform rather than working with it. These costs are real expenditures. They simply get paid in hours and deferred plans instead of euros, which is why they stay off the ledger.
The cost of waiting for a developer
On many legacy enterprise platforms, the merchandising team cannot change much on its own. A new campaign landing page, a revised promotion, a seasonal navigation change: each of these becomes a ticket, and each ticket joins a release queue. The work itself might take a developer an afternoon. The waiting around it takes weeks.
This is the most expensive cost most teams never count, because it does not look like a cost at all. It looks like the normal cadence of getting things done. But consider what it actually represents: a marketing team whose speed is capped by an engineering backlog, an eCommerce manager who plans campaigns around release windows rather than around the market, and a developer dependency baked so deeply into daily operations that nobody thinks to question it. The platform did not send a bill for any of this. It collected the cost anyway.
The cost of integrations you maintain forever
An enterprise operation is never just a storefront. It is a storefront connected to an ERP, a PIM, an OMS, a warehouse system, a tax engine, and whatever else the business has accumulated. On a legacy stack, many of these connections are custom integrations, and a custom integration is not a one-time build. It is a standing maintenance obligation.
Every API that changes upstream, every version upgrade, every new market that needs a slightly different data flow becomes maintenance work on connections that already exist. This is the difference between an infrastructure problem and a process problem: a process can be improved once and left alone, while infrastructure has to be kept alive. The retainer that quietly covers this work is visible. The growing share of it spent simply preventing existing connections from breaking is not.
The cost of campaigns that ship late
The first two costs compound into a third that is harder to measure and more consequential than either. When every change waits for a developer and every integration demands maintenance, the operation moves slower than the business needs it to. Campaigns that should have shipped before a peak window ship during it, or after. Tests that would have informed the next quarter never run. The roadmap does not get cancelled; it gets deferred, one reasonable delay at a time.
This is the cost that does not even register as platform-related, because it shows up as a missed opportunity rather than a line of spend. A campaign that launches two weeks late is not recorded as a platform cost. It is recorded, if at all, as a campaign that underperformed. But the lateness was structural, and the structure was the platform. That is the quiet logic of operational drag: it converts a platform limitation into what looks like a series of unrelated execution problems.
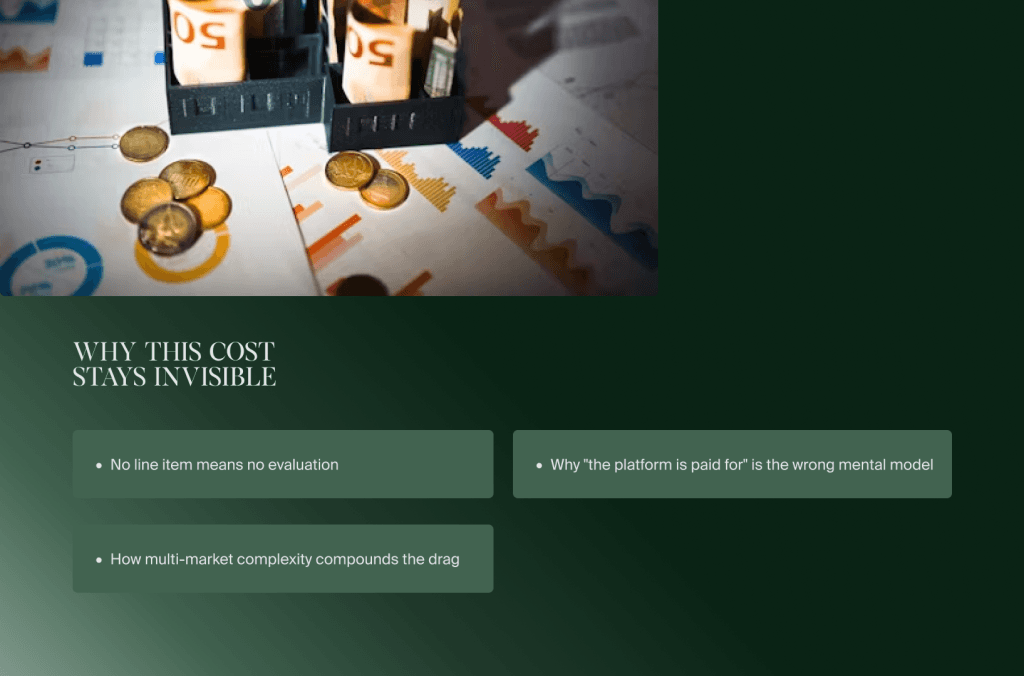
Why this cost stays invisible
By now the costs themselves are clear enough. The harder question is why an operation can carry them for years without naming them. The answer is not that enterprise teams are careless. It is that the structure of a budget, the shape of a multi-market operation, and a single comfortable assumption combine to keep these costs out of view. Each one is worth looking at directly, because seeing the mechanism is what makes the cost evaluable.
No line item means no evaluation
Organizations evaluate what they measure, and they measure what has a place to be recorded. A license fee has a place: it sits on a contract, flows into a budget line, and gets reviewed when that line comes up for renewal. Operational drag has no such place. There is no field on the platform budget labeled “hours lost to the release queue” or “share of retainer spent keeping integrations alive.”
So the cost is not hidden in the sense of being concealed. It is hidden in the sense of being unrecorded, and an unrecorded cost behaves as if it does not exist. It never enters a review, never gets compared against an alternative, never has to justify itself. The absence of a line item is not a small accounting gap. It is the entire reason the largest platform cost goes unexamined while the smallest one gets negotiated every year.
How multi-market complexity compounds the drag
For a European enterprise, the drag rarely stays constant, because the operation rarely stays simple. A brand selling across several markets carries VAT logic that differs by country, fulfillment that crosses borders, language localization, and data handling that has to satisfy GDPR at the operational layer rather than as an afterthought. On a legacy stack, each of these dimensions tends to become its own integration, its own maintenance stream, its own source of tickets.
This is why two operations paying the same license fee can carry completely different real costs. A single-market brand and a brand running eight European markets are not on the same platform in any meaningful operational sense, even when the contract says they are. Complexity multiplies the drag rather than adding to it, and multi-market European operations sit at the high end of that multiplication. The contract does not reflect this. The calendar does.
Why “the platform is paid for” is the wrong mental model
Underneath all of this sits one assumption that does more to hide the cost than any accounting gap: the belief that once the contract is signed and the build is live, the platform is paid for. It is the mental model of a purchase, something bought once and then owned. But an enterprise platform is not a thing you own. It is a condition you operate under, and you pay for that condition continuously, in the currency of how much your operation can do and how fast.
This is the second-order insight the whole cost picture turns on. A legacy platform can feel inexpensive precisely because its largest costs are not in the contract. They are in the release queue, the maintenance load, and the deferred roadmap, none of which present a bill. “The platform is paid for” is true on the invoice and false in the operation. Replacing that mental model with a more accurate one, that the platform charges you every day in throughput, is what finally makes the hidden cost visible enough to measure.
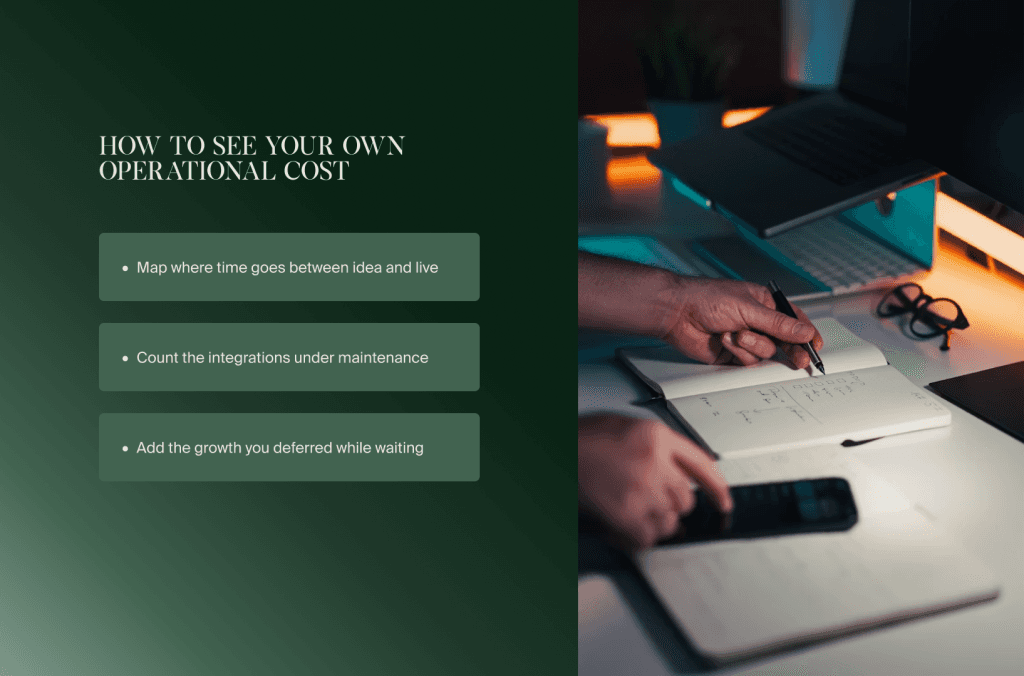
How to see your own operational cost
Naming the cost is one thing. Measuring your own is what turns the idea into something you can act on, and the useful part is that none of it requires special tooling or a consultant. The numbers already exist in your operation. They are simply scattered across places a budget does not look. Three exercises pull them together, and each one can be run this week with information your team already has.
Map where time goes between idea and live
Pick a representative change from the last quarter. A campaign page, a promotion, a navigation update, anything the business decided it wanted live. Then trace the full timeline: the date someone decided to do it, and the date it actually went live. Not the hours of work involved, but the calendar distance between intent and execution.
That gap is your time-to-live, and it is the single most revealing number about operational drag. Do it for five or six changes and a pattern appears: how long the operation actually takes to move when it wants to, and how much of that duration is work versus waiting in a queue. The waiting is the cost. A team that consistently sees three weeks between idea and live is paying for a platform that moves at a fraction of the speed the business is asking for, whatever the contract says about uptime.
Count the integrations under maintenance
Make a list of every system the storefront connects to: ERP, PIM, OMS, warehouse, tax, payment, marketing tools, anything with a live data flow. Mark which of those are custom or semi-custom connections rather than native, supported ones. Then, for each, estimate the time spent in the last year not building anything new, but keeping the existing connection working through upstream changes and version updates.
That figure is your maintenance load, and it tends to surprise people, because it is usually folded invisibly into a development retainer that reads as a single number. Pulling it apart is exactly the kind of breakdown that separates a platform’s contract price from its operating cost, and it is worth doing in the same spirit as a full cost decomposition of a platform’s pricing, where the variable and ongoing costs matter far more than the headline figure. The maintenance line is rarely the one teams expect to be large. On a legacy stack carrying years of custom connections, it often is.
Add the growth you deferred while waiting
The third number is the hardest to pin down and the most important, because it is the one the other two cause. Look back over the last year and list the things the team wanted to do but did not, where the reason was capacity or speed rather than strategy. Tests not run. Markets not opened. Features the eCommerce team had been waiting on. Campaigns that shipped late or not at all.
You will not get a precise euro figure here, and you do not need one. The list itself is the evidence. It is the deferred roadmap made concrete, and it answers the question the standard cost view cannot: not what the platform costs to run, but what running on it costs you in growth you never captured. A team that can fill this list quickly is looking at the real price of its platform, and it is a price that appears nowhere on the invoice.
What the real cost picture changes
Three numbers, taken together, change the conversation. Once you can see your time-to-live, your maintenance load, and your deferred roadmap, the platform stops being a fixed cost you signed for and becomes a variable cost you are paying continuously. That shift sounds small. In practice it changes which question you are asking, and the question you ask determines the decision you eventually make.
From “what does it cost” to “what is it costing us”
“What does it cost” is a question about the contract, and the contract answers it cleanly. “What is it costing us” is a question about the operation, and it has a different answer, usually a larger one. The first question gets asked at renewal and gets resolved in an afternoon. The second one rarely gets asked at all, which is why operations stay on platforms that are quietly capping them long past the point where the math has turned against the arrangement.
The move from the first question to the second is the entire purpose of measuring the three numbers. It does not tell you to change anything. It tells you what you are actually paying, so that any decision you make about the platform is made against the real figure rather than the contract figure. A platform decision is a commitment of five to seven years for most enterprises. Making that commitment against the wrong cost number is how operations end up surprised by a platform that felt affordable and turned out to be the most expensive thing they ran.
The comparison worth making next
Seeing the true cost of your current platform naturally raises the next question: how would that real cost compare against an alternative, measured the same way? That is the comparison most platform evaluations get wrong, because they line up license fees against license fees and call it an analysis. The honest version lines up operating costs against operating costs: time-to-live against time-to-live, maintenance load against maintenance load, the speed each platform actually allows the business to move.
That is a more demanding comparison to run, and it is the one that produces a decision you can stand behind for the length of the contract. If you want to see what that looks like applied to a specific choice, weighing a modern enterprise platform against the legacy stacks most enterprises are running, an honest comparison of Shopify Plus against legacy enterprise platforms is the next step worth taking. The point is not which platform wins. The point is that the comparison is only meaningful once both sides are measured by what they cost to operate, not by what they charge to sign.
Running that comparison properly, and then executing on what it recommends, is exactly the kind of work our ecommerce agency does for clients weighing this decision.
Related articles